A/B testing performance overview
Describes how you can use the default campaign report to get a performance overview of your A/B testing campaign.
You can use the AB performance overview report to view a summary of the overall statistics of your A/B split test campaign.
To get the AB performance overview:
On the menu bar, click Reports > Campaign Reports.
Click the campaign you want to view.
On the menu on the left, click AB performance overview.
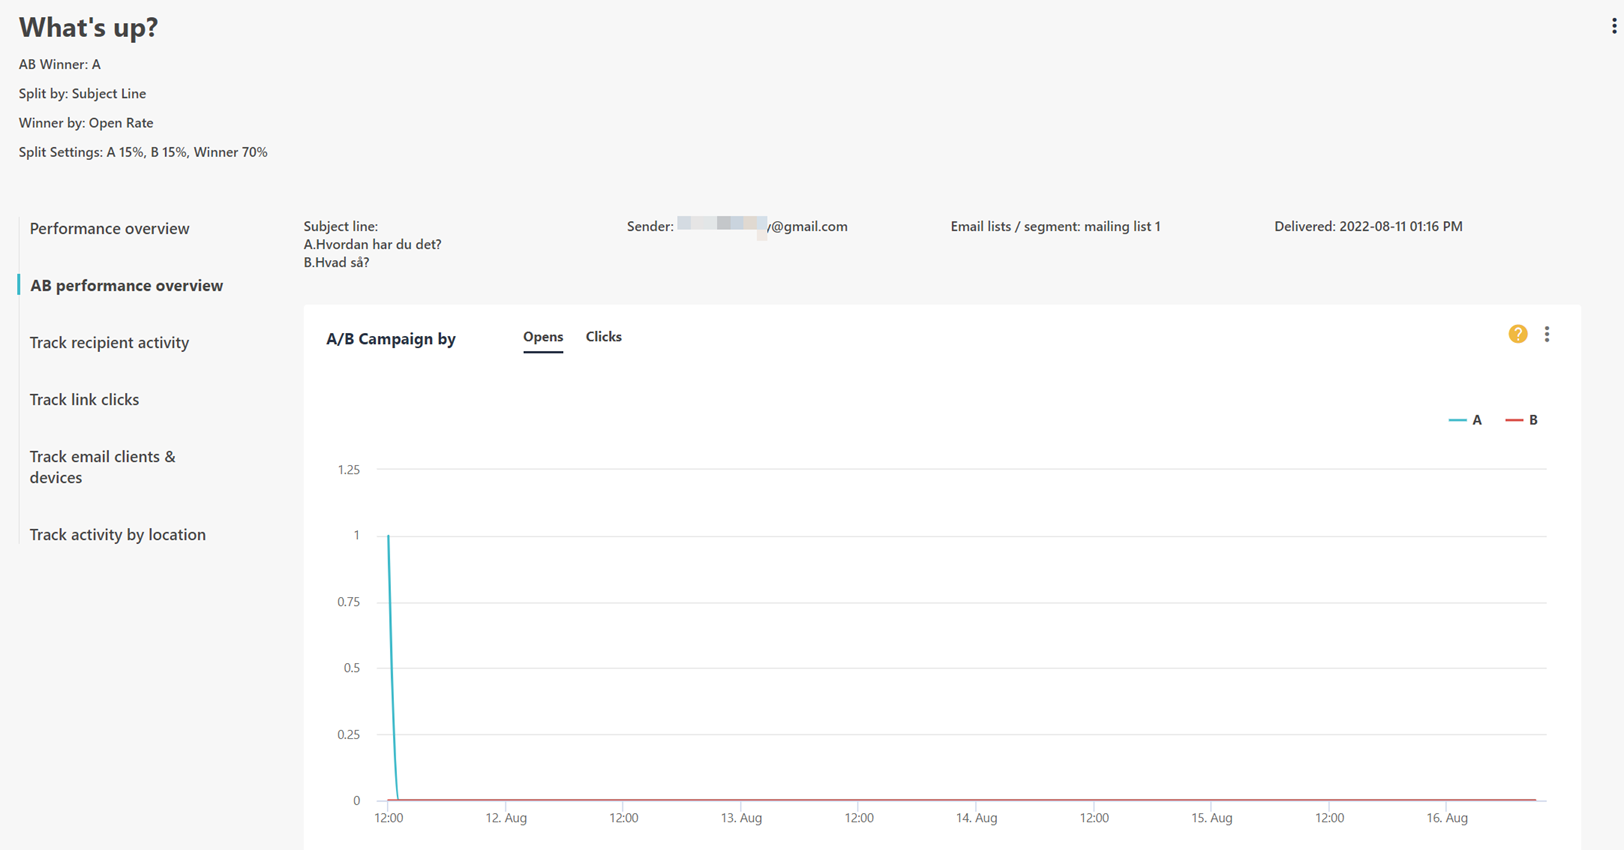
You can now view the following basic information and widgets:
AB Winner - the winning campaign.
Split by - the criteria used to split test the campaign: by subject line, by content, or by from name.
Winner by - the criteria used to determine the winning campaign.
Split settings - the percentage of your email list selected for A/B split testing.
A/B Campaign by - a graph comparing the opens and clicks of campaigns A and B.
Note
You can click the Opens or Clicks tab to switch from one view to the other. You can also click A or B to select which campaign data to display on the graph.
Recipients - the total number of recipients of your campaign.
Opens - the open rate percentage of your campaign. For example, if you have sent a campaign to 100 recipients and you have 20 unique opens, the open rate percentage is 20%.
Clicks - the percentage of recipients who have clicked your campaign. The number of unique link clicks is also displayed.
Unsubscribes - the percentage of recipients who have clicked the unsubscribe link in your campaign. The total number of unsubscribed recipients is also displayed.
To download the information as a PDF, in the top-right corner of the widget you want to download, click
 and click Download PDF.
Optionally, you can click Export Data to export the information to your account email as a CSV file.